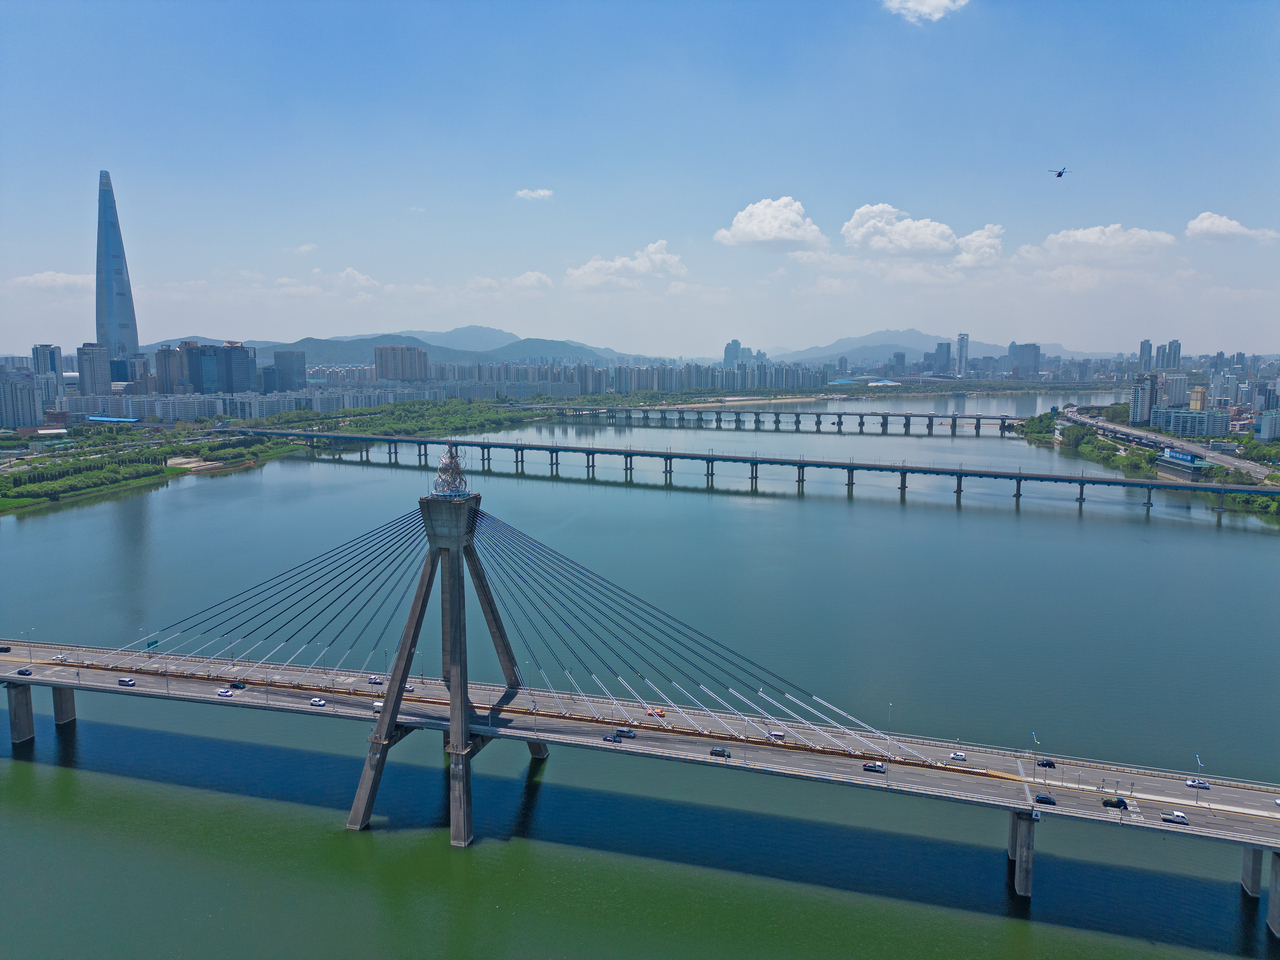
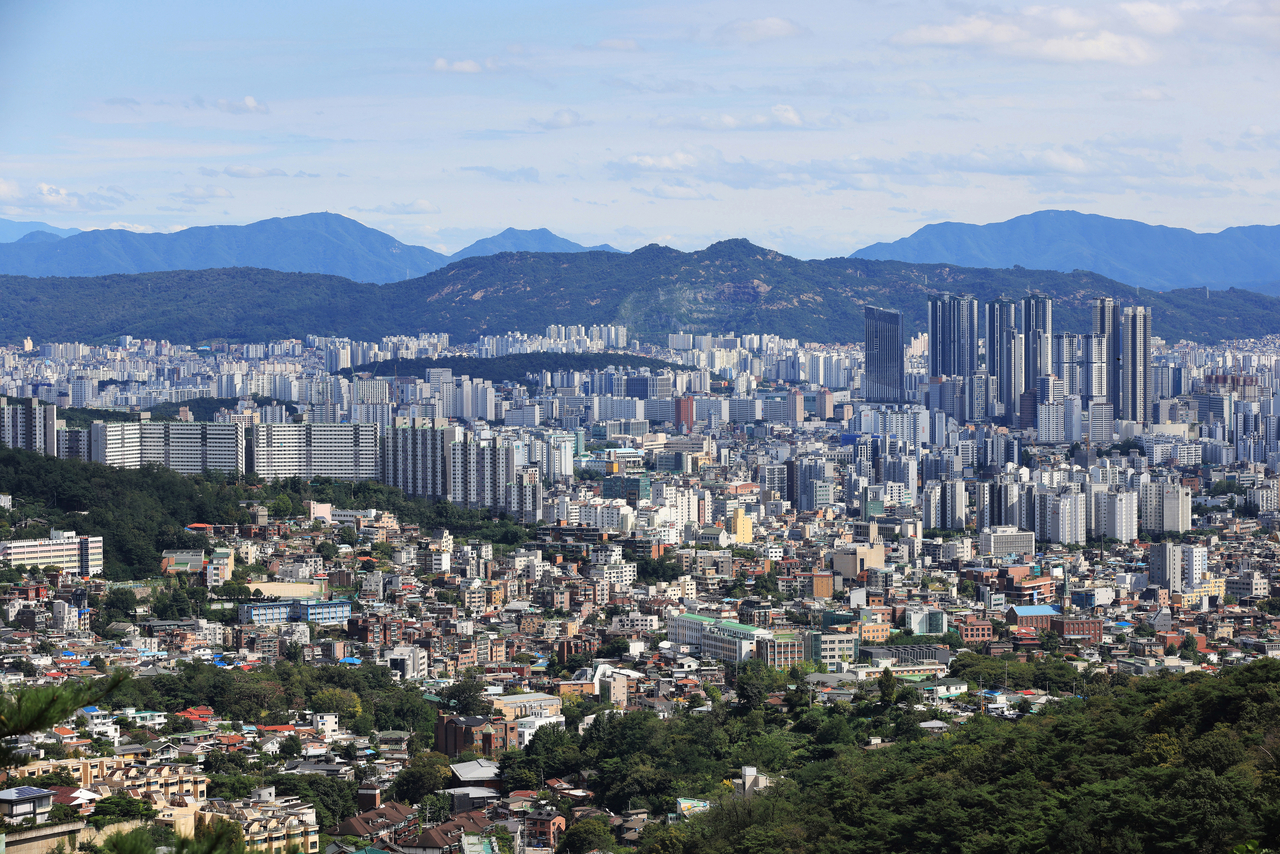
Seoul, a megacity bustling with nearly 10 million residents, is considered one of the safest places to live among major cities across the globe.
Aside from anecdotal evidence of Seoulites leaving their cellphones and bags in public places to save a spot without concern of theft, international media outlets regularly place the South Korean capital near the top when ranking the most secure cities in the world. A 2025 ranking by CEO World rated Seoul 27th out of 300, and the Economist Intelligence Unit's ranking had ranked it 25th in 2021 and eighth overall in 2019.
As in all cities, however, the level of safety in Seoul varies across districts. So, which neighborhoods are considered more dangerous, and how can you find the latest information on the relatively low-risk areas?
Korea Safety Map
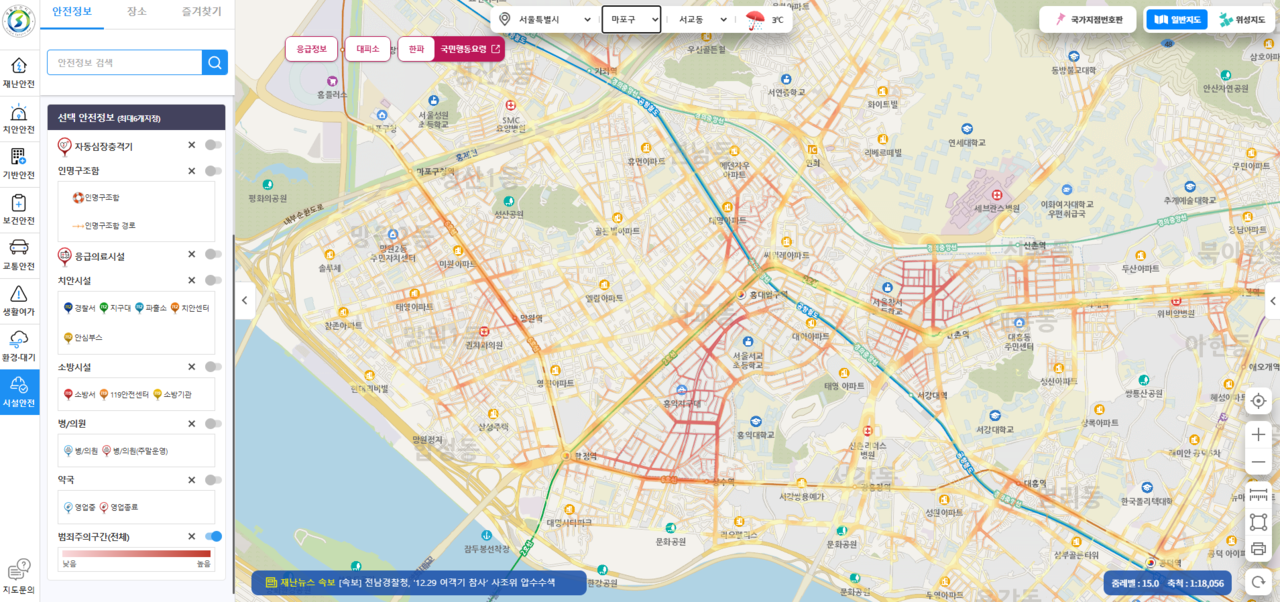
The Ministry of Interior and Safety's Korea Safety Map allows you to see the safety levels in specific regions across the country. Information can be filtered by categories such as crime, traffic, natural disasters, safety for the vulnerable, facilities, industries, public health and man-made disasters. Though accessible online and via mobile application, these services are provided only in Korean.
To access the map, go to the aforementioned address or the app of the same name and click on the "Saenghwal Anjeon Jido."
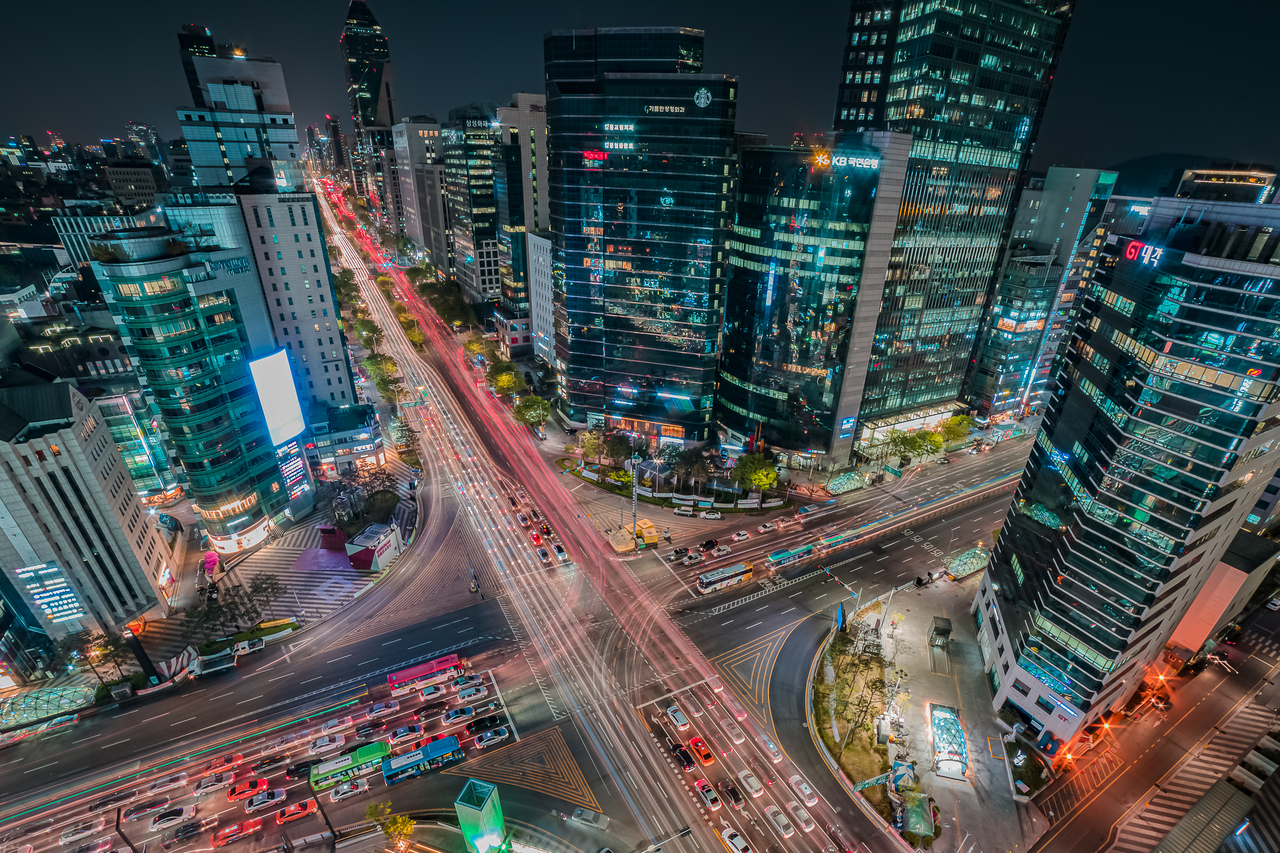
After selecting the desired category and filter, you can then zoom in and out of the map to see which areas have recorded higher rates of the selected crimes. The map uses a 10-level color rating that goes from light yellow, for a lower frequency of incidents, to dark red, for a higher frequency. For example, the commercial area immediately north of Gangnam Station, which has heavy foot traffic, is "redder," but the area around the apartment complexes west of the station has more yellow.
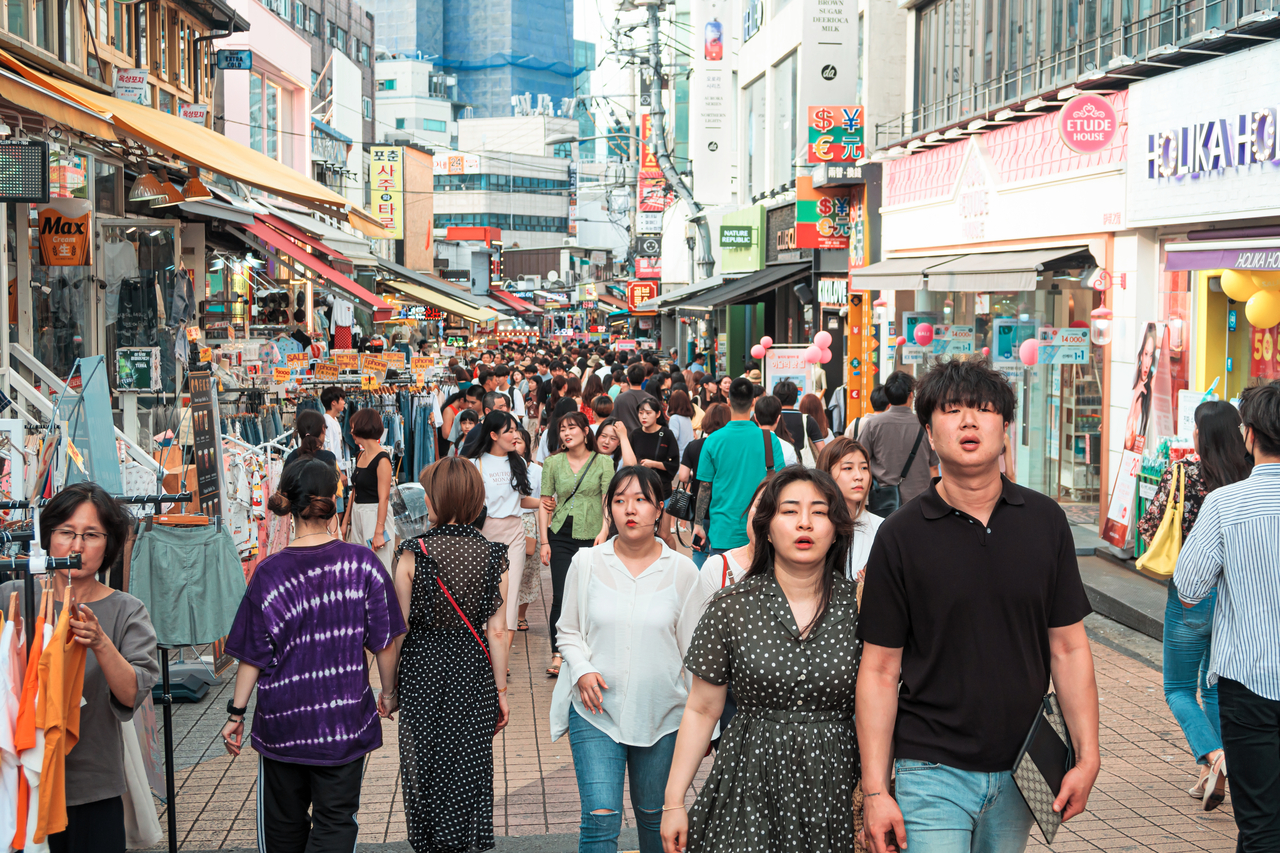
The famous hangout district of Hongdae is generally red, likely due to the concentration of bars and nightlife that draw crowds at night. Crime rates tend to be higher in areas with a large floating population, a factor to consider when choosing a neighborhood.
The "safety" category allows you to see the frequency of specific crimes. Party districts packed with clubs, for example, tend to have higher rates of sexual violence, assault and theft, but crimes such as robbery or murder are generally lower.
Areas where women, older adults and children are particularly vulnerable to crime can also be filtered under the safety category.
The Korea Safety Map offers other useful information, including real-time road information, location of accidents, as well as other information, such as the location of nearby hospitals and pharmacies.
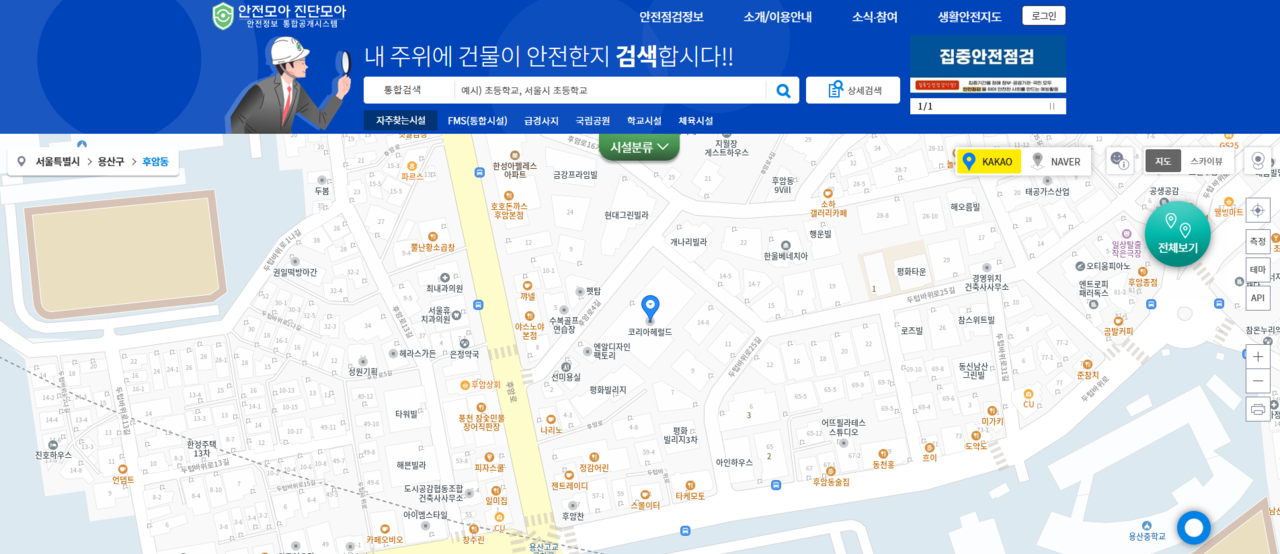
Its main page also provides the link to the Anjeon Moa Jindan Moa website, which you can access at https://safewatch.safemap.go.kr/main/main.do. This allows you to check the structural integrity of a specific building.
By typing in the name of your building, you can search for the most recent safety inspection on the facilities in the building and view the inspection's results. The commercial-residence building where I currently stay in Sinchon, for example, passed safety inspections for its mechanical parking facility and elevator last year.
Safety indexes
The homepage also provides the link to the jiyeok anjeon deunggeup, or regional safety index, which the Safety Ministry has compiled and released each year since 2015. Each city, province or district is rated one through five — one being the safest — under the categories of traffic accidents, fire, crime, suicide, infectious diseases, and "living safety," referring to other miscellaneous hazards in everyday life.
Seongbuk-gu, for example, received a Grade 1 rating in terms of crime; Grade 2 under suicide; Grade 3 for living safety, fire, and infectious disease; and Grade 5 for traffic accidents in the 2024 review.
You can also see how a region's rating has changed over the years in the upper-right section of the page. Seongbuk-gu was given a Grade 2 rating for crime from 2016 to 2019, but this rose to Grade 1 in 2020, indicating that the district has become safer.
Gangnam-gu's crime index, however, sat at Grade 4 from 2016-2021, but dipped to Grade 5 in 2022, where it has remained since.
Seoul as a whole received a Grade 1 rating under traffic accidents; Grade 2 for living safety, suicide and infectious diseases; Grade 3 in crime and Grade 4 in fire.
Another often-cited index is the civilian Korea Security Index, jointly compiled by university-affiliated think-tanks: analysis firm Kstat and local media outlet Money Today. This particular index looks at safety, financial activities, health and housing to give a score out of 100.
The 2025 report showed that Seocho-gu and Yangcheon-gu ranked No. 1 and No. 2 for Seoul, with scores of 62.85 and 60.41, respectively. Gangnam-gu was next in the city at 59.33, followed by Yeongdeungpo-gu (58.98), Songpa-gu (58.94), Gangdong-gu (58.94), and Seongdong-gu (58.61).
Keep in mind that this is a comprehensive index that considers multiple factors, not just safety.
There is an ongoing debate about the lack of readily accessible raw crime data in South Korea, with the public having limited access to detailed crime statistics for a specific region in real time. To read more on this issue, check an earlier article from this series, "S. Korea's safest cities? Data blackout clouds the picture."
'Crime map' of Seoul
In 2021, a local scholar made an effort to sort the areas in Seoul by dong — administrative areas within a "gu" (district), comparable to a neighborhood — based on the frequency of crimes such as robbery, arson, sexual violence, assault, theft, illegal drug use, gambling and murder.
This map was shown in research titled "Spatial Patterns of Crime in Seoul, Korea: An Empirical Analysis at the Administrative Dong Level," which categorized each neighborhood into five levels. The research sought to provide a detailed analysis of crime-prone zones for smaller areas and was published in the Journal of Korean Criminological Association.
According to the report, 53.3 percent of these areas in Seoul received a rating of either Grade 4 or 5 for sexual violence, indicating that such crime happens frequently in the city. Arson appeared to be the least frequent crime, with 31.1 percent of the neighborhoods rated Grade 1 and 30.9 percent Grade 2.
The report also revealed that Grade 4 and 5 regions were concentrated mostly in the outer regions of the city, including a huge chunk of the southwestern part. By district, murder was more frequent in Gangseo-gu, Yeongdeungpo-gu and Dongjak-gu, while robbery was concentrated in Gangnam-gu, Seocho-gu, Gangdong-gu, Gwanak-gu and Guro-gu.
Gangnam-gu and Seocho-gu recorded the highest rates for drug and gambling crimes.
The researchers noted that insufficient access to crime statistics on a district level hinders research and restricts related studies, and "limits analysis of the crime data provided for wider areas or coming up with policy suggestions."
Raw criminal data
Criminal data is accessible via the homepages of the National Police Agency, the Supreme Prosecutors‘ Office, or the Korean Statistical Information Service. However, data from most government agencies provide information on a city or provincial level.
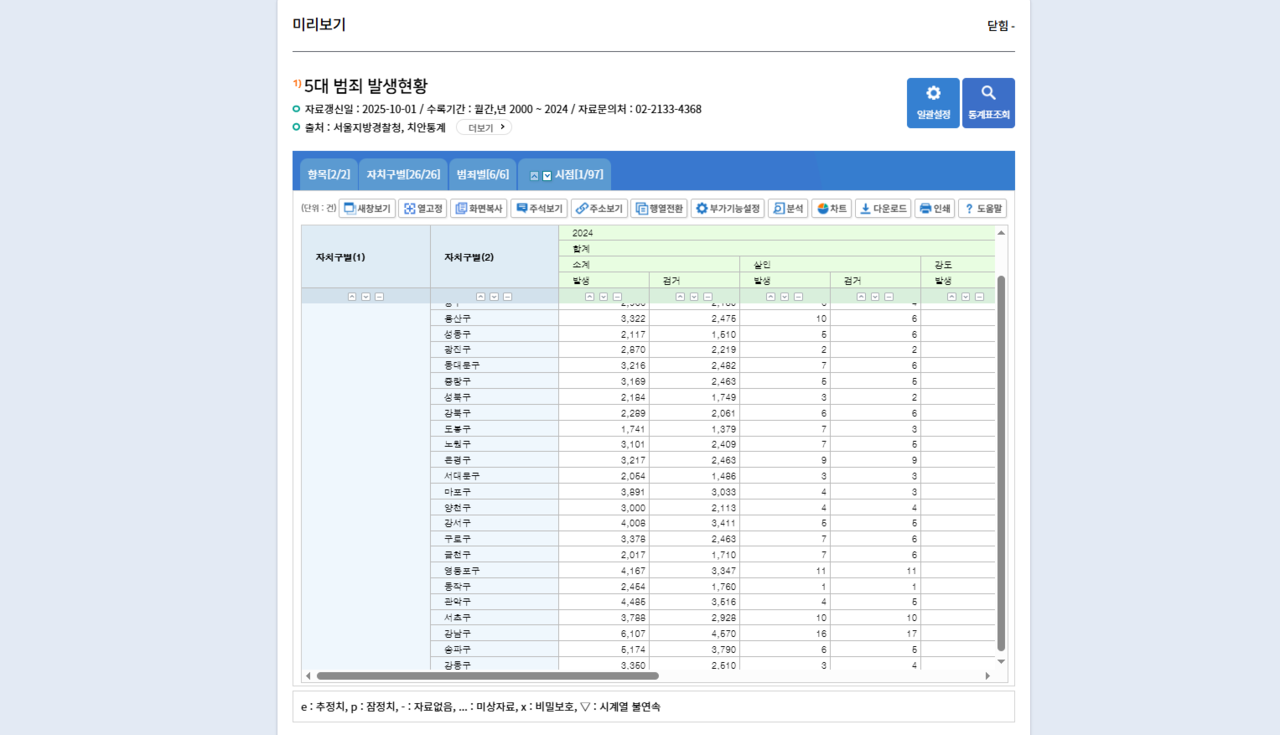
Seoul Metropolitan Government provides the data for five major crimes — murder, robbery, rape and sexual molestation, theft, and assault — based on the data from the Seoul Metropolitan Police Agency. This data, however, shows the total number of crimes and arrests made on the gu level, and does not consider factors like the population.
For example, a total of 2,955 crimes occurred in Jung-gu as of 2024, while 2,870 took place in Gwangjin-gu. These numbers may look comparable at first glance, but Gwangjin-gu has a population of around 330,000, which means the crime rate per capita for Jung-gu's some 120,000 population is much higher.
As such, determining which area is the safest from raw data takes additional research and deduction, which is why many have called for more detailed crime data for research purposes.